The CTEM Chronicles: Mobilization, Turning Insight into Action

Introduction: Why CTEM Stalls Without Mobilization
Now is when the rubber hits the road. You and your team have already done the heavy lifting in the previous phases:
- Scoping – You drew sharp, business-first boundaries around the very first CTEM cycle so the team tackles a focused slice (for example, one crown-jewel application or dataset), and are finishing this loop inside 30–45 days
- Discovery – You moved past “run the scanner and read the list” and built an attacker-eye view of everything in scope, surfacing CVEs and misconfigurations, forgotten assets, over-privileged identities and chained attack paths, all mapped back to business context.
- Prioritization – You shifted from “highest CVSS wins” to risk that blends exploit likelihood, active threat activity and asset criticality, filtering out the noise and ensuring finite resources point at exposures that could truly hurt the business today.
- Validation – You turned theory into evidence by proving which high-ranked exposures are actually exploitable in your environment, using targeted PoCs, manual chaining or simulated attacks so stakeholders see real risk, not guesses
All that work answers the question “What really matters?” Mobilization answers the harder follow-up: “What are we going to fix first, and when?”
This phase is not a one-off patch blitz. It is a continuous lane inside every sprint that directs energy only at the exposures that matter right now, drives them to “done” within SLA and then rolls straight on to the next wave. Treat mobilization this way and CTEM stops being an expensive observation deck and starts shrinking real risk.
In this episode we’ll discuss a tried-and-tested framework for running continuous mobilization. You will learn how to sort findings by real-world danger, assign clear owners, run fast-lane “strike squad” rituals and track a visible burn-down so effort lands exactly where it counts and nowhere else.
Hook and Context: The Red-Dashboard Rut
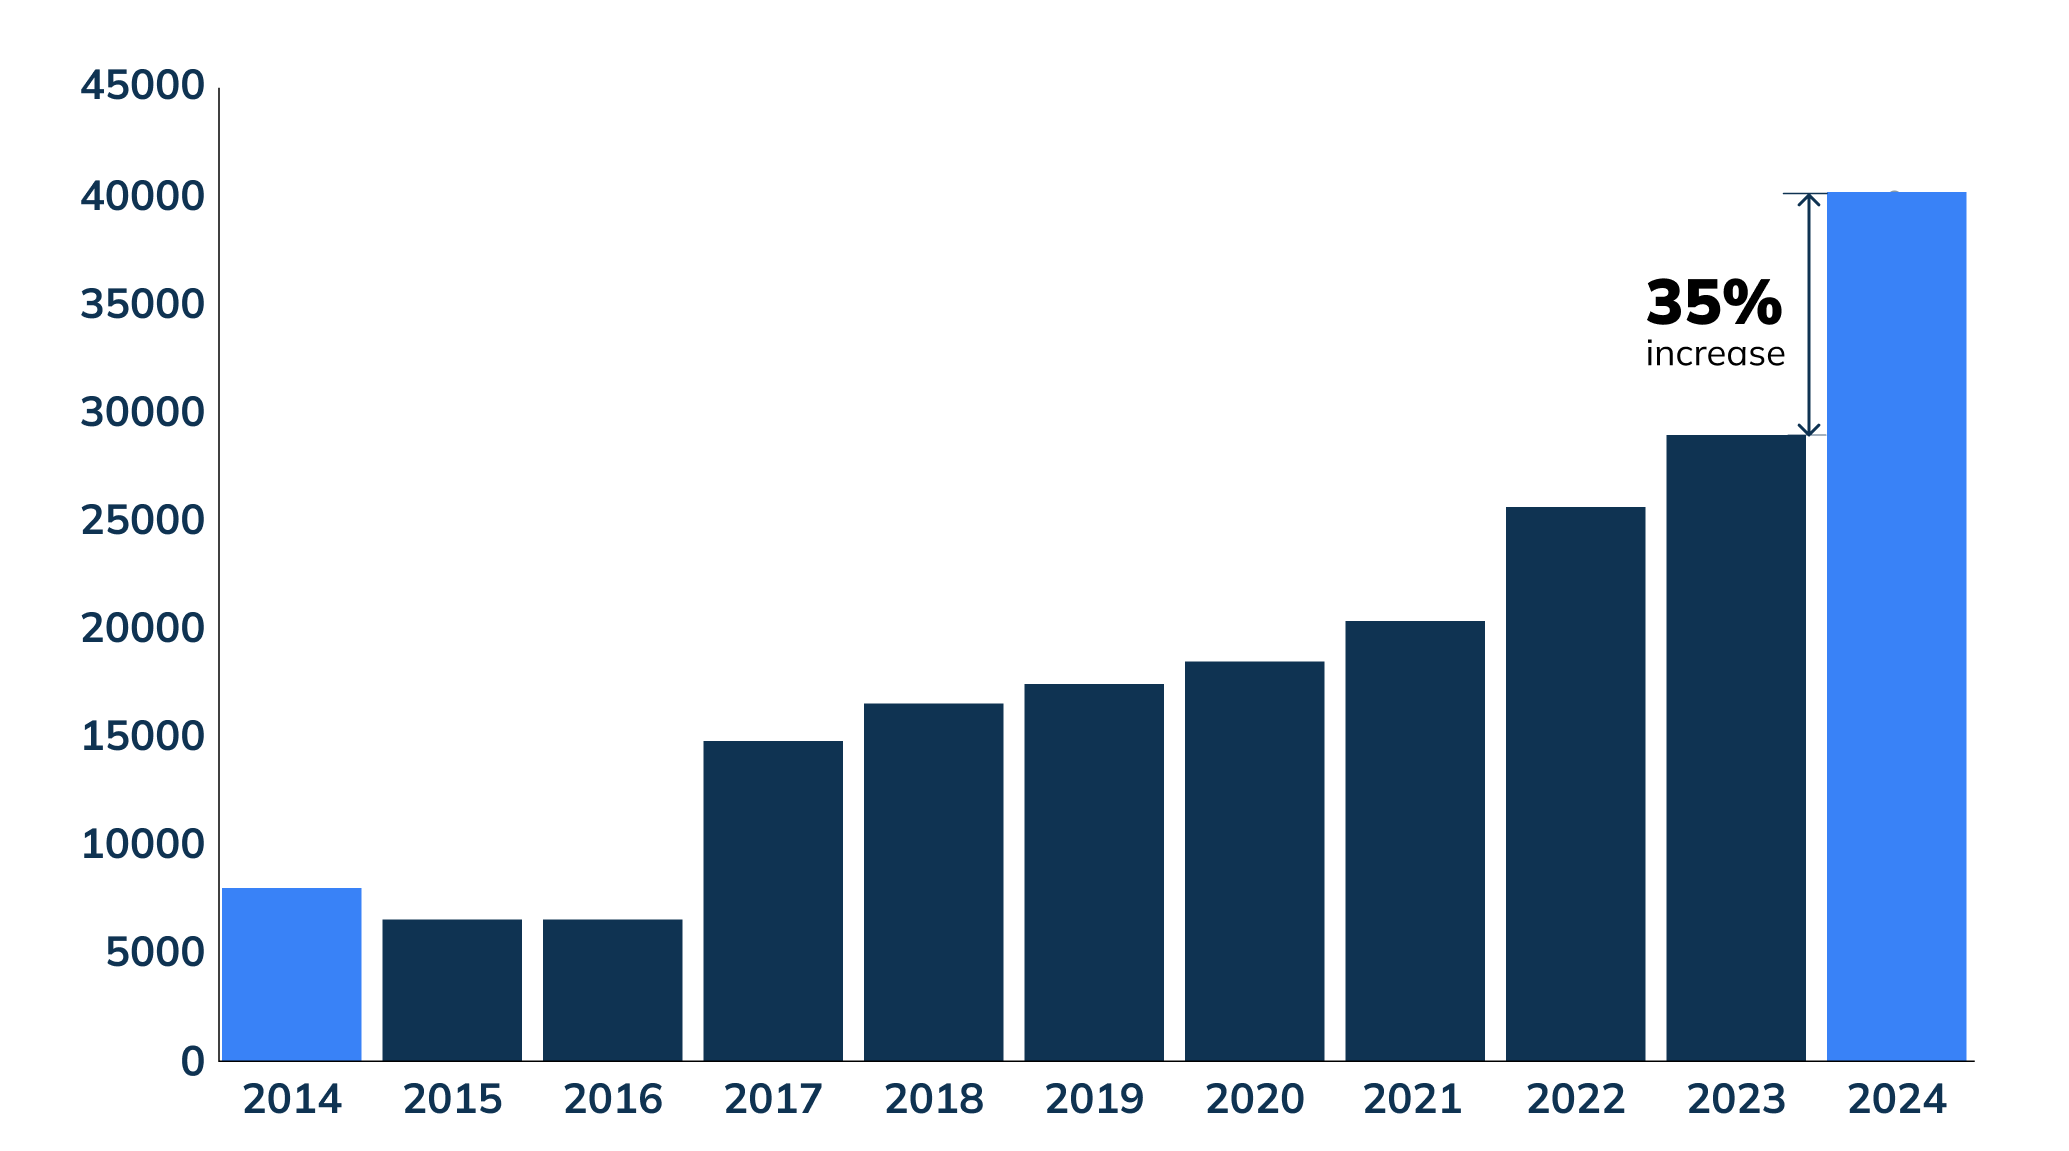
The NVD dashboard recorded 40,301 new CVEs in 2024, up from 29,066 the year before, a jump of roughly 38 percent. Security teams have the potential to face well over a hundred fresh vulnerabilities every single day.
Attackers do not wait for tidy patch cycles. When CVE-2024-4577 dropped, Akamai saw exploit attempts within 24 hours of disclosure.
Working harder will not close that gap. Mobilizing smarter will.
What Should be Happening Now?
Mobilization is assigning an owner, a priority and a due date to every validated exposure, then tracking each one to closure with visible, risk-centered metrics. Anything less is still analysis.
Four Pillars for Effective Mobilization
1. Ownership Mapping: Turning “Someone Should” into “This Individual Will”
- Name every owner. Pull tags from the CMDB or run a quick survey but never allow “Infrastructure Team” to stand in for a person.
- Use a lightweight RACI. Responsible, Accountable, Consulted, Informed – and embed it in every ticket.
- Automate the check. A ticket cannot be saved unless the Responsible field contains a name.
2. Risk-Based Prioritization Queues
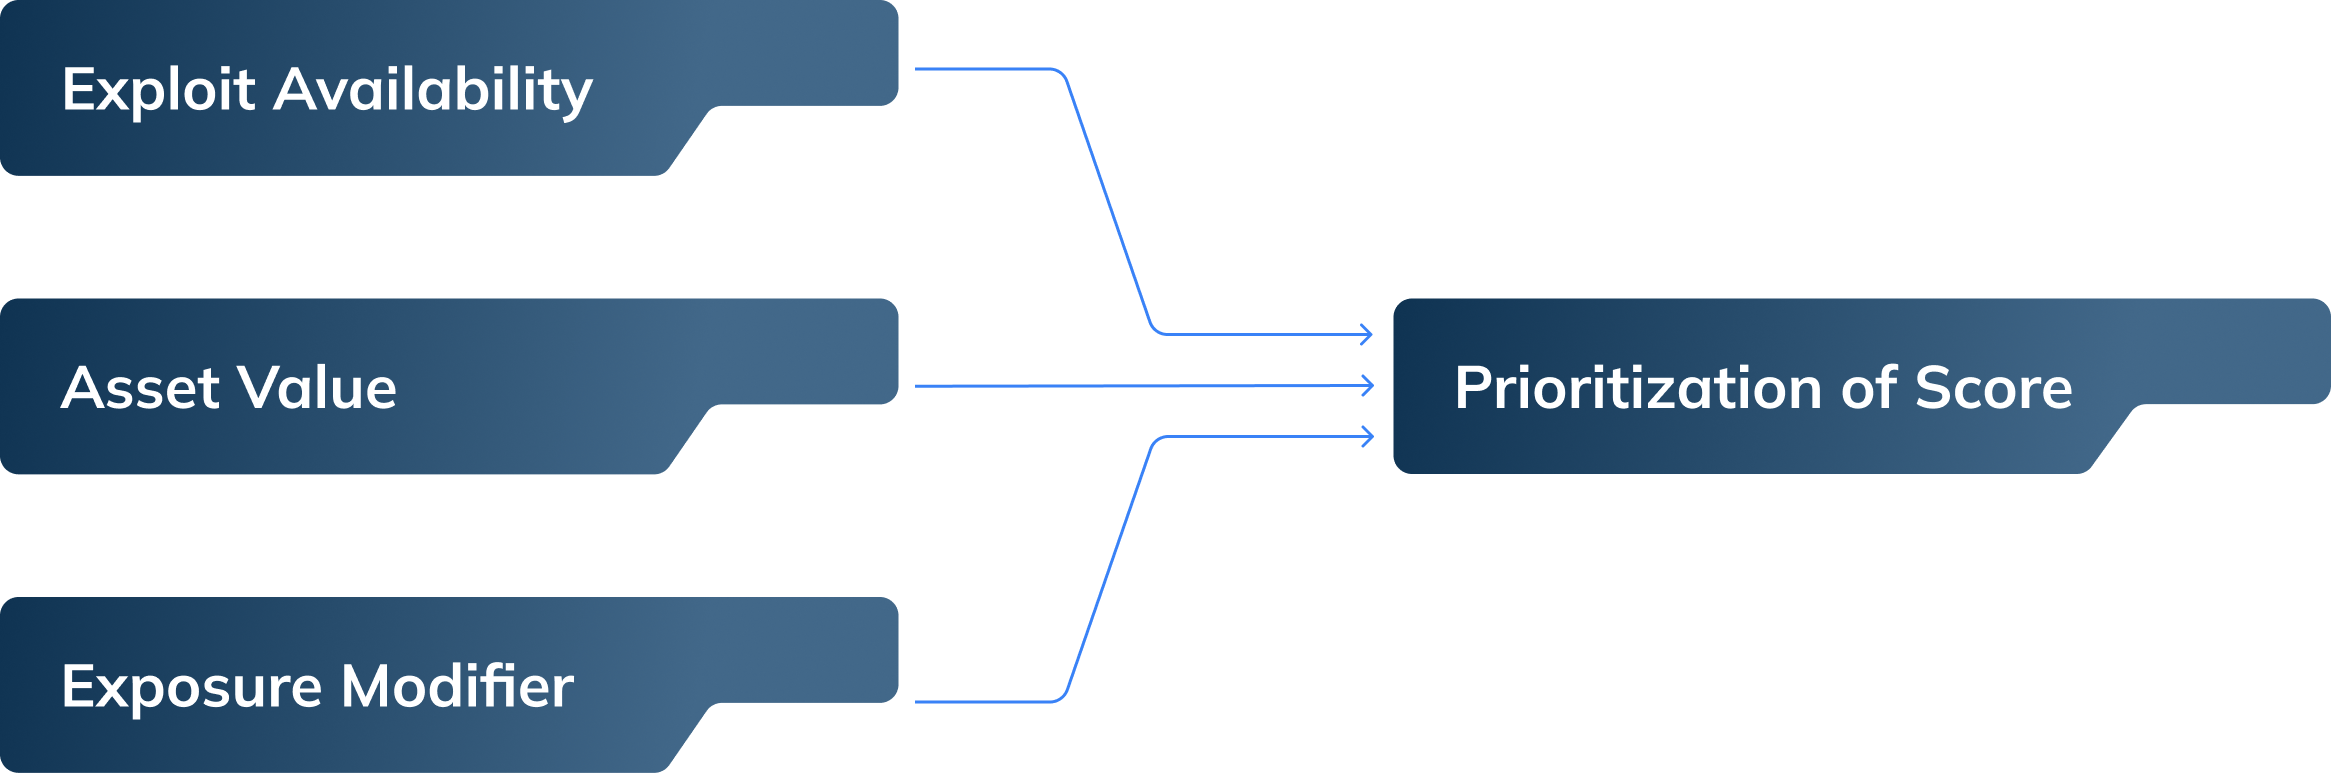
At this point we have a list of validated vulnerability data and attack paths to in scope systems. You may still need to prioritize down to 10 addressable items, so that the momentum continues. We recommend using a simple formula such as this prioritization score.
Here are some hypothetical examples:
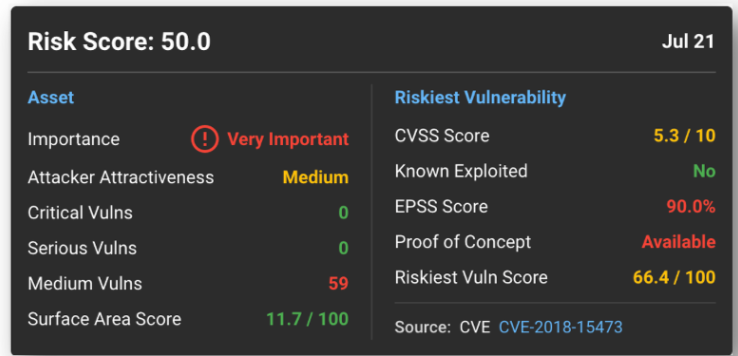
The highest scores go first; low-risk backlog can wait. Feel free to modify these variables to align with your organization. Evolve Security utilizes EPSS, Attacker Attractiveness and other variables to provide a Risk score to help our clients prioritize and rank vulnerabilities.
3. Strike-Squad Rituals: What they are and how they work
A strike squad is a small, cross-functional group that exists for one purpose: to knock the highest-risk items off the queue before they become tomorrow’s incident. Think of it as a standing emergency crew that blends decision-makers and doers so nothing gets stuck “waiting for approval”.
Cadence and format
- Frequency: Twice a week, thirty minutes. Daily in a crisis, weekly in a quiet spell.
- Inputs: The top ten items from the risk queue, already scored and sorted.
Agenda
- Security lead states the exposure, the risk score and the proposed fix. Make sure to articulate the business value of the assets in the current attack paths.
- Owner commits to how and when the fix will land.
- Group identifies blockers, access, test data, change window, and assigns who will clear them.
- Meeting ends when all ten items have an agreed path to “done”.
TIP: If these meeting are lasting longer than 30 minutes consider lowering the item threshold to 5
No slides, no lengthy context re-caps. Cameras on, mics unmuted, finish on time.
The Fast-Lane Rule
Critical items with exploit code in the wild jump the normal change queue.
- Change-control delegate records the exception in the CAB log.
- The Owner raises a post-change review within twenty-four hours, so good practice catches up once the danger has passed.
Why It Works
- Velocity: decisions made in the room mean fixes start the same day(or as close to it as possible)
- Accountability: Every item leaves with a named owner and a due date.
- Focus: Only ten items per meeting keeps the team from being overwhelmed.
- Low overhead: thirty minutes, twice a week is enough to maintain momentum without turning into another bureaucracy.
4. Feedback Loops and KPI Reporting
Publish a one page every Friday:
Color-code misses in red and hits in green. Visibility fuels urgency.
Tip: Budget 20-30% of each engineering sprint for mobilization tasks. Anything less and the backlog tends to grow faster than you can burn it down.
Handling Push-Back
In an ideal world, all the work done prior to this phase should prepare you and your team to encounter no push back. That being said, old habits die hard and you may run into these common objections.
- “There’s no bandwidth for this.”
Show the risk-sorted backlog and offer to drop low-risk items in exchange for action on the top five.
- “Our Change window is frozen.”
Present the blast radius and negotiate a micro-window or feature-flag fix.
- “This is too expensive.”
Compare fix cost with your sector’s average breach cost (IBM puts it at $4.88 million).
There are useful cyber breach calculators and reports which can provide a more tailored estimate given your existing security stack.|
https://www.ibm.com/security/data-breach
https://www.riskiq.com/
https://www.cisa.gov/cybersecurity
Success Metrics: Knowing Mobilization Works
You do not need twenty spreadsheets to show progress, just four core numbers, tracked every week and shown as a trend line rather than a one-off snapshot.
Meantime to Remediate (MTTR)
What it measures:
Average working days from ticket open to ticket closed. Break it out by severity (critical, high, medium).
How to measure it:
Ticketing system can export created date and closed date; simple subtraction.
Healthy Signals:
Target less than 7 days for critical, less than 30 days for high, less than 60 days for medium. (Align this to your continuous vulnerability management policy)
Exposure Burn-Down
What it measures:
Percentage change in the number (or risk-weighted score) of open findings week-on-week.
How to measure it:
Burn-down = (Open last week – Open this week) ÷ Open last week × 100
Healthy Signals:
A steady downward slope, greater or equal to 5 % weekly drop for critical items shows momentum.
Exploit Lag
What it measures:
Days between public exploit code and the fix hitting production. Measures how long attackers have a free shot.
How to measure it:
Combine public exploit-publish dates (KEV, Exploit-DB feeds) with ticket close dates.
Healthy Signals:
Target less than 48 hours for critical internet-facing flaws; and less than 7 days for high severity.
Ticket Bounce Rate
What it measures:
Percentage of “fixed” tickets that re-open during validation or QA. Signals quality of remediation.
How to measure it:
(Re-opened this week ÷ Closed this week) × 100.
Healthy Signals:
Target less than 10 %. A rising rate means owners are rushing fixes or skipping tests.
Where to next?
Fixing faster is only part of the journey. In Episode 7 you will benchmark progress with Evolve Security’s CTEM Maturity Model – a clear ladder from Ad Hoc to Optimized that shows exactly what “leveling-up” looks like for each CTEM phase. Stay tuned.